 Encyclopædia Neurochirurgica
 Spontaneous intracerebral hemorrhages


Imaging
*1/Techniques
Non-contrasted Computed Tomography (CT) Scan remains the gold standard for the diagnosis of ICH. However, MRI T2 * has the same sensitivity and has the advantage of being able to differentially diagnose it from an ischemic lesion. Both techniques can therefore be used, with the choice depending largely on the availability of machines (I, A) (8). It is worth noting that in case of early imaging (less than 3 hours), the bleeding may still be active. The identification of patients with active bleeding and therefore a risk of neurological deterioration could be of therapeutic interest although this attitude has not yet been validated (IIb, B). Active bleeding can be demonstrated by the extravasation of contrast product into the hematoma, visible on both CT and MRI angiographies (3,16).
*2 / Radiological semiology (25)
a-CT
During the acute phase, the ICH appears as a spontaneous intraparenchymal hyperdensity, exerting a mass effect on adjacent structures. A hypertensive cause is suspected with deep seated hematoma (Figure 1).
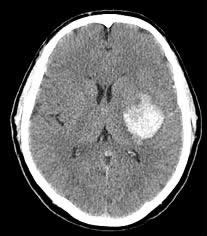
- Figure 1: Left capsular and thalamic spontaneous intraparenchymal hematoma whose topography is suggestive of a hypertensive cause.
When the hematoma is lobar, it does not preclude a hypertensive cause but amyloid angiopathy is more likely in older patients (Figure 2).
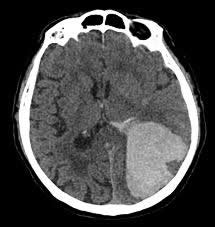
- Figure 2: Left parietal-occipital lobar hematoma, suggestive of amyloid angiopathy in a hypertensive and / or aged patient. The cortical nature and its large volume is an indication for surgery.
From Day 3 a ring of hypodensity appears reflecting an increase in the peri-lesional edema. Secondary hemoglobin degradation will cause a change in the density of the hematoma: the hyperdensity will decrease from the periphery to the center as from D4-D5. From the 2nd to the 9th week the hyperdensity decreases and is replaced by an iso- and then a hypodensity. It then remains as a hypodense "scar".
b-MRI
The topography and morphology of the ICH on the MRI are of course superimposable to the CT description. The paramagnetic properties of the hemoglobin degradation products produces a complex MRI signal change with time, which we will briefly describe (Table 1):
| T1 Sequence | T2 Sequence | |
|---|---|---|
| Acute : 8-72h | Isointense | Hypointense |
| Early Subacute (D3-D7) | Isointense with peripheral hypersignal | Hypointense |
| Late SubAcute (First Week-Month) | Hyperintense | Hyperintense peripheral hyposignal |
| Late (Month-Years) | Hypointense | Hypointense |
![]() In the Acute stage (8 to 72H), the signal will be determined by the presence of intracellular deoxyhemoglobin: the hematoma will appear as isointense on T1 and hypointense on T2. This T2 hypointensity is even more pronounced on T2 gradient echo (T2 *), which makes it the reference sequence for the early MRI diagnosis.
In the Acute stage (8 to 72H), the signal will be determined by the presence of intracellular deoxyhemoglobin: the hematoma will appear as isointense on T1 and hypointense on T2. This T2 hypointensity is even more pronounced on T2 gradient echo (T2 *), which makes it the reference sequence for the early MRI diagnosis.![]() In the Early Subacute Stage (D3-D7, Figure 3a and b): the intracellular methemoglobin will cause a peripheral hyperintensity on T1 weighted images and hypointensity on T2 weighted images.
In the Early Subacute Stage (D3-D7, Figure 3a and b): the intracellular methemoglobin will cause a peripheral hyperintensity on T1 weighted images and hypointensity on T2 weighted images.
- Figure 3: MRI axial cut of a right capsular and thalamic hematoma in the early subacute phase (D3-D7). On T1W1 –the hematoma appears as a central isointensity with a hyperintense rim (a).On T2W1, the hematoma appears hypointense (b).
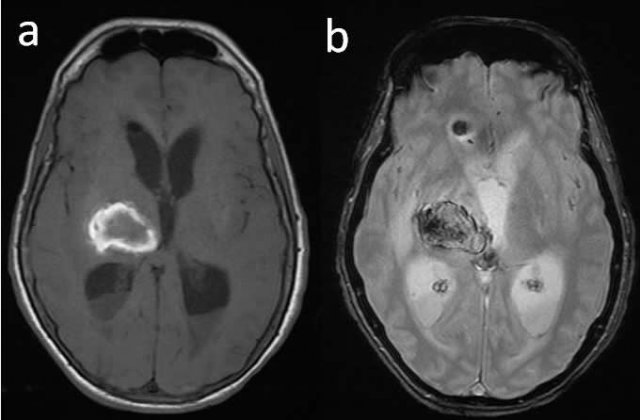
![]() In the Late Subacute Stage (first week- month, Figure 4a and b), T1 hyperintensity and a central T2 hyperintensity with hypointense peripheral borders in relation to the presence of extracellular methemoglobin.
In the Late Subacute Stage (first week- month, Figure 4a and b), T1 hyperintensity and a central T2 hyperintensity with hypointense peripheral borders in relation to the presence of extracellular methemoglobin.
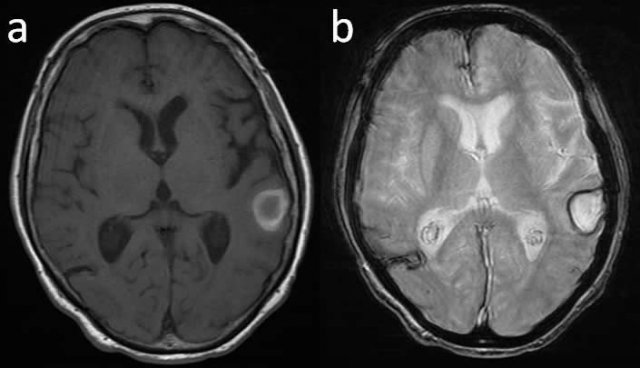
- Figure 4: MRI axial cuts of a cortico-subcortical hematoma in the late subacute phase (weeks-months). T1W1-, hematoma begins to appear hyperintense T1 (a). In T2W1, the hematoma is hyperintense with a hypointense peripheral ring (b).
![]() Late-stage (month-year), hypointensity on both T1 and T2 related to hemosiderin deposits.
Late-stage (month-year), hypointensity on both T1 and T2 related to hemosiderin deposits.
*3/Diagnosis of secondary ICH (differential diagnosis)
a-Etiology of secondary ICH
Faced with ICH one should exclude a lesion underlying the hematoma such as: arterial aneurysm, arteriovenous malformation, dural fistula, cavernoma, venous angioma, cerebral venous thrombosis, brain tumor, cerebral vasculitis.
b-Techniques
MRA and CTA are sufficiently sensitive and specific to detect an underlying cause, and are therefore indicated as first-line examinations (31). In the event of a strong clinical index of suspicion or any doubt about the MRA or CTA findings, conventional angiography which is the gold standard should be performed (31). If there is a very strong index of suspicion, these tests may be repeated remotely.
c-Indications
When should a secondary cause for ICH be suspected and when should vascular imaging be done? The following criteria were considered discriminative to request for these complementary tests (IIa, B) (31.50):![]() Context: Patient under 45 years with a negative history of hypertension.
Context: Patient under 45 years with a negative history of hypertension.![]() Clinically: neurological symptoms (headache, deficit ...) preceding the SICH.
Clinically: neurological symptoms (headache, deficit ...) preceding the SICH.![]() Radiologically: Associated subarachnoid hemorrhage.
Radiologically: Associated subarachnoid hemorrhage.
- Lobar ICH: superficial, supratentorial.
- Isolated intraventricular hemorrhage.
Prognostic factors
The mortality rate at six months is between 23 and 58%, and almost half of survivors will live a dependent life (26,40,44). Prognostic factors of death in the short term are as follows (9.20):![]() advanced age.
advanced age.![]() an initial low GCS score.
an initial low GCS score.![]() the volume of ICH, which can be determined by the formula ABC/2 (see section on score).
the volume of ICH, which can be determined by the formula ABC/2 (see section on score).![]() an increase in the volume of the hematoma.
an increase in the volume of the hematoma.![]() an associated IVH of which the severity directly correlates to mortality. This can be evaluated using the Graeb’s score (see section on score).
an associated IVH of which the severity directly correlates to mortality. This can be evaluated using the Graeb’s score (see section on score).
For example, a patient with a GCS less than 9 and an ICH volume greater than 60 ml has a one month mortality risk of 90%, whereas a patient with a GCS score of above 9 with a hematoma of less than 30 ml carries a one month mortality risk of 17% (4).
Scores
*1 / Calculation of the hematoma volume (Figure 5)
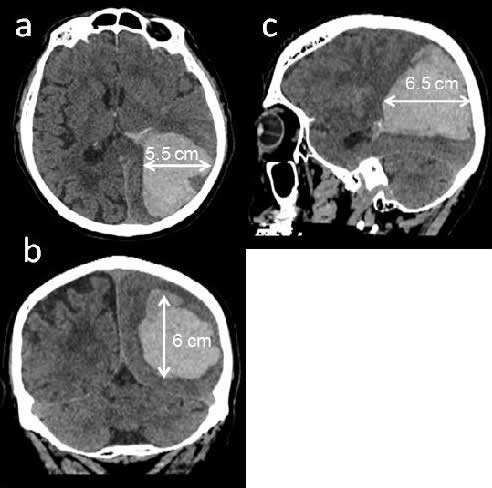
- Figure 5a, b, c: Calculation of the volume of the hematoma according to the / 2 ABC rule, or A, B and C are the greatest diameters of the hematoma in the 3 planes. Here is A = 5.5 cm, B = C = 6 cm and 6.5 cm, so an estimated volume was 107.5 ml.
The volume of the hematoma can simply calculated using the following formula (4):
![]()
Where A, B and C are the largest diameter of the hematoma in centimeter in 3 the spatial planes.
* 2 / Graeb Score (Figure 6) (17)
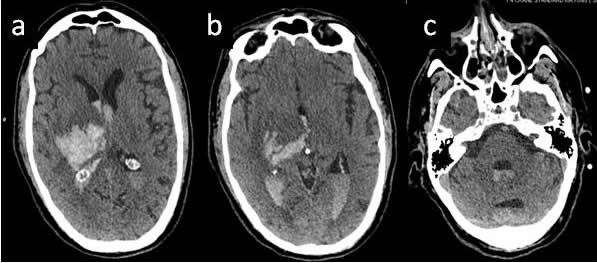
- Figure 6 a, b and c: spontaneous capsule-thalamic hematoma with right ventricular extension. Graeb score = 8/12.
Is designed to evaluate the severity of the IVH. It is quoted on 12 and the components are:
A-Lateral ventricles (Right and Left lateral ventricles scored separately):
1 = trace of blood or moderate bleeding.
2 = less than half the ventricle filled with blood.
3 = more than half of the ventricle filled with blood.
4 = fully filled with blood and dilated ventricle.
B-Third and fourth ventricles (Third and Fourth ventricles scored separately):
1 = blood present, size normal
2 = filled with blood and expanded
Graeb score = right ventricular score + left ventricular score + 3th ventricular score + 4th ventricular score
*3/ Mortality Prognostic Score (20)
The following score based on independent prognostic factors of death, enables us to determine the risk of mortality at 1 month after the initial episode. There is a linear relationship between the score and the risk of death.
At 0, the risk of death is zero. At 6, the risk is more than 80%.
Method of calculation:
a-GCS score:
3–4 =2 points
5–12 = 1 point
13–15 = 0 point
b- ICH Volume, cm3 :
≥30 : 1 point
<30 : 0 point
c-Intraventricular Hemorrhage:
Yes: 1 point
No : 0 point
d- Infratentorial Origin of Hemorrhage:
Yes : 1 point
No : 0 point
e-Age, years:
≥80 : 1 point
<80 : 0 point
Total Score: 0-6